도커로 그라파나 구동
https://grafana.com/docs/grafana/latest/installation/docker/
도커로 그라파나 구동 w/ 플러그인
https://community.grafana.com/t/2603
grafana-cli 로 플러그인 설치
https://grafana.com/grafana/plugins/grafana-worldmap-panel/installation
그라파나 공식 GitHub repo< https://github.com/grafana >에 있는 것만 설치 가능
플러그인 설치 후 grafana-server 재시작 필요
그라파나 플러그인 찾기
https://grafana.com/grafana/plugins 에서 찾아보기
Google 검색 [ site:https://grafana.com/grafana/plugins/ <검색어> ]
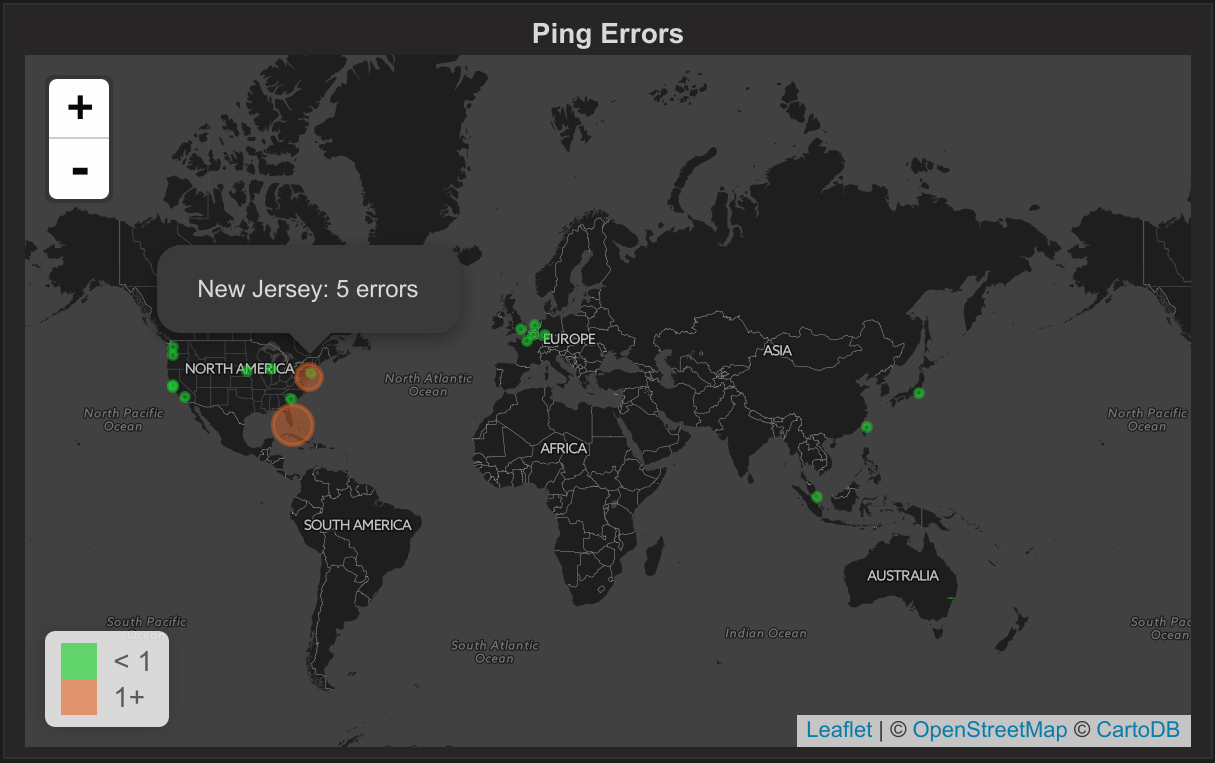
WorldMap 플러그인
지리적 위치에 이벤트가 몇 개 발생했는지 표시
https://grafana.com/grafana/plugins/grafana-worldmap-panel
GlobalNoc NetworkMap 플러그인
지도/이미지 위에 링크 표시
https://github.com/GlobalNOC/globalnoc-networkmap-panel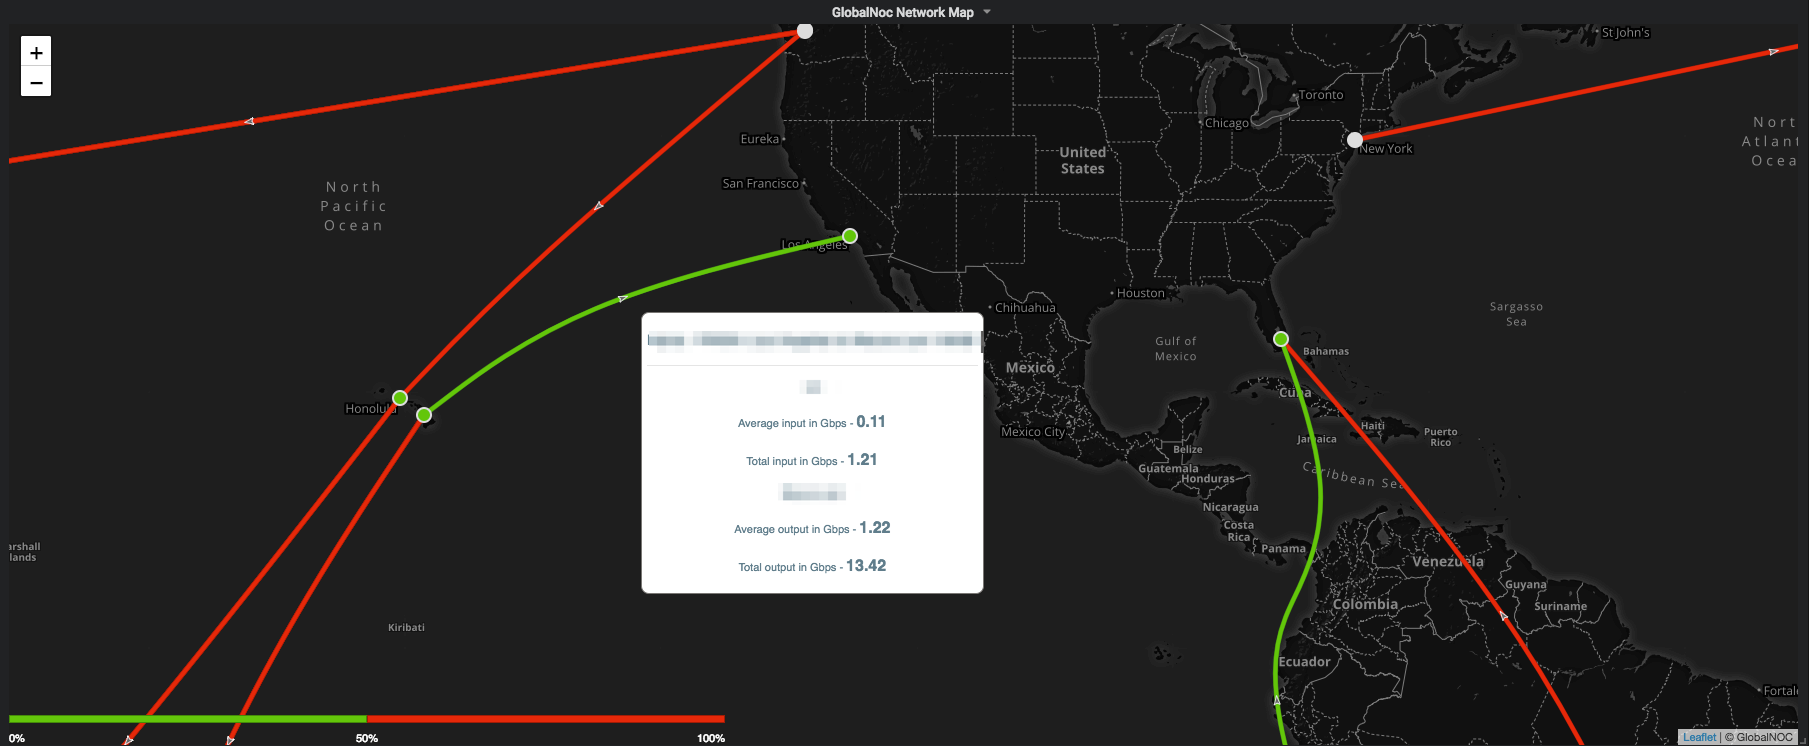
GlobalNoc NetworkMap 플러그인 지도 URL 설정
CartoDB 계열 타일 서버
https://cartodb-basemaps-{s}.global.ssl.fastly.net/light_all/{z}/{x}/{y}.png
https://cartodb-basemaps-{s}.global.ssl.fastly.net/dark_all/{z}/{x}/{y}.png
https://{s}.basemaps.cartocdn.com/light_nolabels/{z}/{x}/{y}{r}.png
...

stamen 계열 타일 서버
https://stamen-tiles-{s}.a.ssl.fastly.net/toner-lite/{z}/{x}/{y}{r}.png
https://stamen-tiles-{s}.a.ssl.fastly.net/terrain/{z}/{x}/{y}{r}.png
https://stamen-tiles-{s}.a.ssl.fastly.net/terrain-background/{z}/{x}/{y}.png
http://tile.stamen.com/watercolor/{z}/{x}/{y}.jpg

Latitude  35.5
Longitude 127.5
Zoom      7
참고 https://github.com/GlobalNOC/globalnoc-networkmap-panel/issues/71
http://maps.stamen.com/#watercolor/6/36.897/130.902
https://github.com/CartoDB/cartodb/wiki/BaseMaps-available
https://github.com/CartoDB/basemap-styles
https://switch2osm.org/serving-tiles/
https://switch2osm.org/serving-tiles/using-a-docker-container/
OpenStreetMap 을 이용해서 Tile Server 를 만들고 serving 하면 grafana 에서 쓸 수 있음
우분투 14.04기반의 OpenStreetMap 로컬 타일 서버 - 1부. 구축
https://ssabro.tistory.com/41
http://www.vworld.kr/
http://www.vworld.kr/dev/v4dv_icbbeta_s002.do?brdIde=BTA_0000000000000042
GlobalNoc NetworkMap 툴팁 커스텀
$name $count
$node.label  $node.min   $node.max   $node.avg   $node.current $node.sum
$input.name  $input.min  $input.max  $input.avg  $input.now    $input.sum
$output.name $output.min $output.max $output.avg $output.now   $output.sum
<div class= "wrapper" style= "padding:0px; margin:0px; border-radius:0px; "> <table id= "dataTable">
<tr>
<td colspan = "6" class = "mainTitle">$name</td> </tr>
<tr>
<td colspan = "3" class = "mainHead borderBot">$input.name</td>
<td colspan = "3" class = "mainHead borderBot">$output.name</td> </tr>
<tr>
<td colspan = "1" class = "headerTxt">Min</td>
<td colspan = "1" class = "headerTxt">Avg</td>
<td colspan = "1" class = "headerTxt rightBorder">Max</td> <td colspan = "1" class = "headerTxt">Min</td>
<td colspan = "1" class = "headerTxt">Avg</td>
<td colspan = "1" class = "headerTxt ">Max</td>
</tr> <tr>
<td colspan = "1" class = "bodyTxt">$input.min</td>
<td colspan = "1" class = "bodyTxt">$input.avg</td>
<td colspan = "1" class = "bodyTxt rightBorder">$input.max</td> <td colspan = "1" class = "bodyTxt">$output.min</td>
<td colspan = "1" class = "bodyTxt">$output.avg</td>
<td colspan = "1" class = "bodyTxt">$output.max</td>
</tr> <tr>
<td colspan = "3" class = "mainHead rightBorder">Gb/s</td> <td colspan = "3" class = "mainHead">Gb/s</td>
</tr> </table>
<br/>
<style> .wrapper{ color:snow;
}
.mainTitle{
font-size: 2em; //border-bottom:1px solid; padding:4px; font-weight:bold; color:orange; border-color:white;
}
.headerTxt{ padding:0px;
}
.bodyTxt{ font-weight:bold; font-size:2em; padding:0px;
padding :1px 5px 5px 5px; }
.mainHead{ font-weight:bold; font-size:1.2em; padding-left:20px; padding-right:20px;
}
.borderBot{ //border-bottom:1px solid; color:rgba(18,175,255,1); border-color:white;

}
.rightBorder{ border-right:0.5px solid; }
#dataTable{
table-layout: fixed;
width: 100%;
text-align: center;
}
.atlas-info-div{
border-radius: 2px; background-color:rgba(0,0,0,0.8); }
hr{ padding:0px; margin:2px; }
</style>
<div style="text-align: center; font-size: 20px; color:orange; font-weight:bold; "> $name
</div>
<style>
.atlas-info-div{
border-radius: 2px; background-color:rgba(0,0,0,0.8); }
</style>
https://github.com/GlobalNOC/globalnoc-networkmap-panel/blob/master/src/js/map/NetworkLayer.js#L287
https://portal.netsage.global/
GitHub 으로 배포된 그라파나 플러그인 설치
sudo -s
yum -y install npm

cd /var/lib/grafana/plugins
git clone https://github.com/GlobalNOC/globalnoc-networkmap-panel

cd globalnoc-networkmap-panel
npm install
npm install gulp -g
npm run build

systemctl restart grafana-server
참고1 https://community.grafana.com/t/16190
참고2 https://github.com/GlobalNOC/globalnoc-networkmap-panel/blob/master/BUILD.md
그라파나 서비스 재시작
# sudo systemctl restart grafana.server
그라파나 iframe 이용
grafana.ini 수정 → grafana 서비스 재시작 → text 플러그인에서 html 로 설정 후 iframe 태그 넣기 → 크롬 웹브라우저 특정 사이트 보안수준 낮추기
[panels]
disable_sanitize_html = true
[security]
allow_embedding = true
참고1 https://community.grafana.com/t/text-box-iframe/11663/5
참고2 https://github.com/grafana/grafana/issues/15392
참고3 특정 사이트 보안수준 낮추는 법 (크롬 웹브라우저)
그라파나 토폴로지 그려넣기
mermaid.js 문법으로 삽입
text 부분에 HTML 태그로 링크 삽입 가능