| Vendor | HW | SW on HW | SW | etc |
|---|---|---|---|---|
| Juniper | QFX5120 | Inband Flow Analyzer (IFA) 2.0 | ||
| Cisco | Cisco Nexus 3K, 9K | Streaming Telemetry license (N3K-STR1K9) | ||
| Intel (Barefoot) | Wedge32X | Deep Insight |
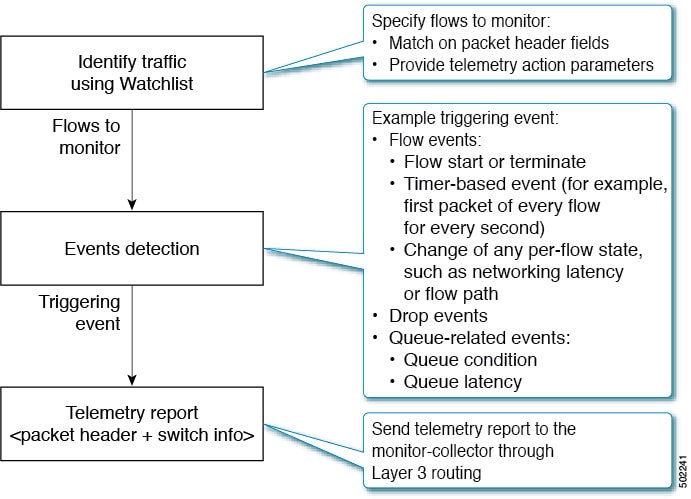
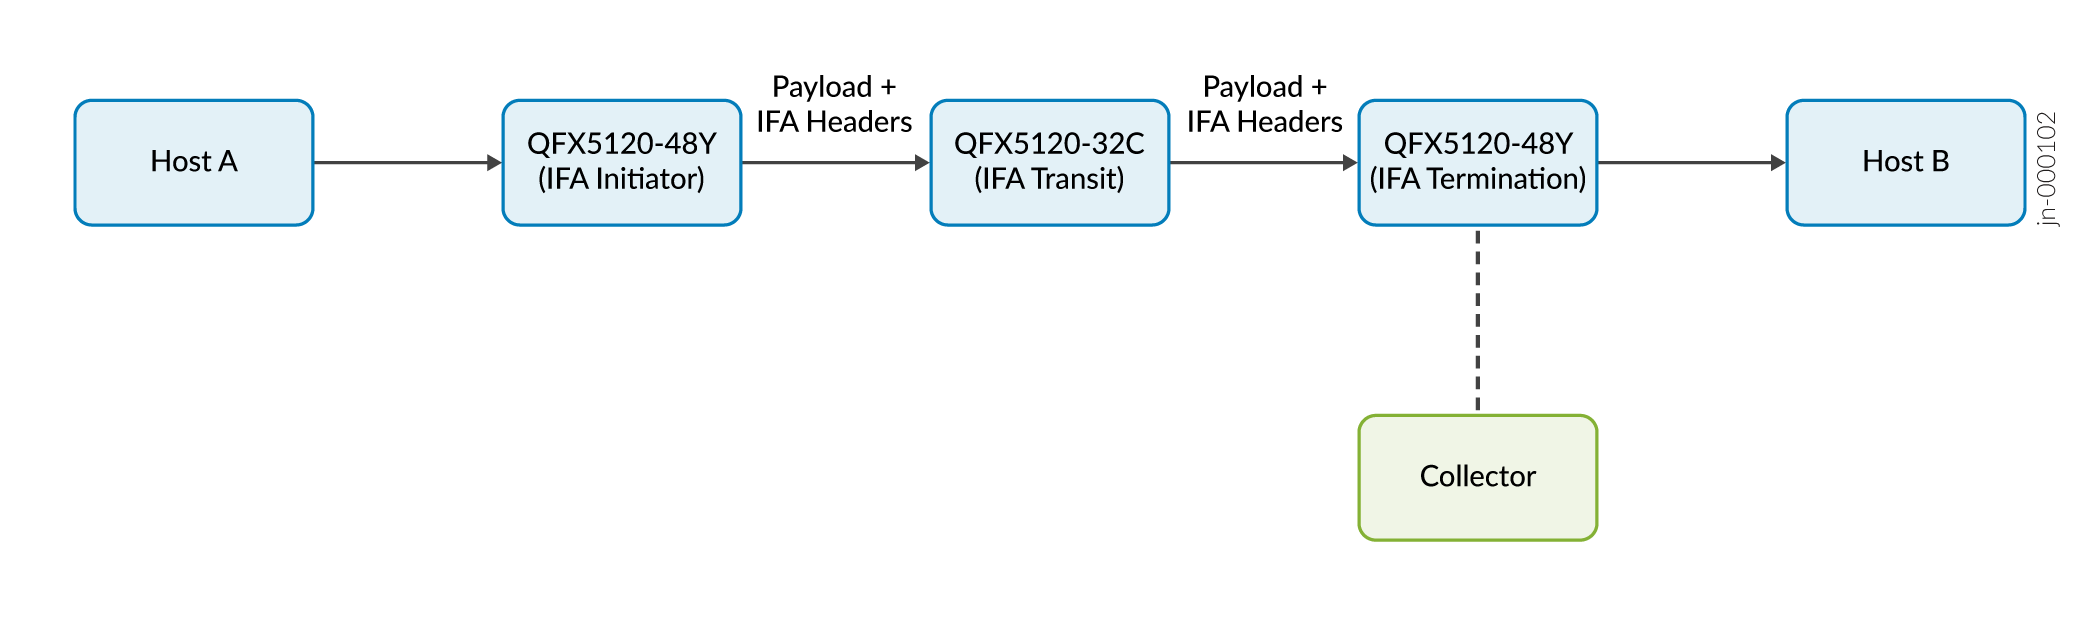
Inband Network Telemetry (INT) is a vendor-neutral network monitoring framework that provides per-hop granular data in the forwarding (data) plane. INT allows you to observe changes in flow patterns caused by 1)microbursts, 2)packet transmission delay, 3)latency per node, and 4)new ports in flow paths.
Collection Params
2022, Inband Flow Analyzer (IFA) 2.0 Probe for Real-Time Flow Monitoring > CLI Quick Configuration
https://www.juniper.net/documentation/us/en/software/junos/flow-monitoring/topics/topic-map/ifa2.0-probe-for-real-time-performance-monitoring.html#concept_rjb_tvr_hrb
2022, Paragon Insights Data Ingest Guide > Understand Inband Flow Analyzer 2.0
https://www.juniper.net/documentation/en_US/healthbot/topics/concept/pi-inband-telemetry-overview.html
2022, Inband Flow Analyzer (IFA) 2.0 Probe for Real-Time Flow Monitoring
https://www.juniper.net/documentation/us/en/software/junos/flow-monitoring/topics/topic-map/ifa2.0-probe-for-real-time-performance-monitoring.html


2018, OCPUS18 – InBand Network Telemetry - A Powerful Analytics Framework for Your Data Center
Speaker: Roberto Mari, Barefoot Networks
https://youtu.be/V7kheCbPh0g
2020, Barefoot Deep Insight Monitoring System Enabled by P4 DataPlane Telemetry
https://opennetworking.org/wp-content/uploads/2020/12/9_Daniel_Alvarez_DI.pdf
Cisco Nexus 3000 Series NX-OS Programmability Guide, Release 9.3(x)
Cisco Nexus 9000 Series NX-OS Programmability Guide, Release 9.2(x)
2019, Explore MDT(Model-Driven Telemetry)
https://blogs.cisco.com/developer/model-driven-telemetry-sandbox
Report Types
Following are the different types of reports used by INT:
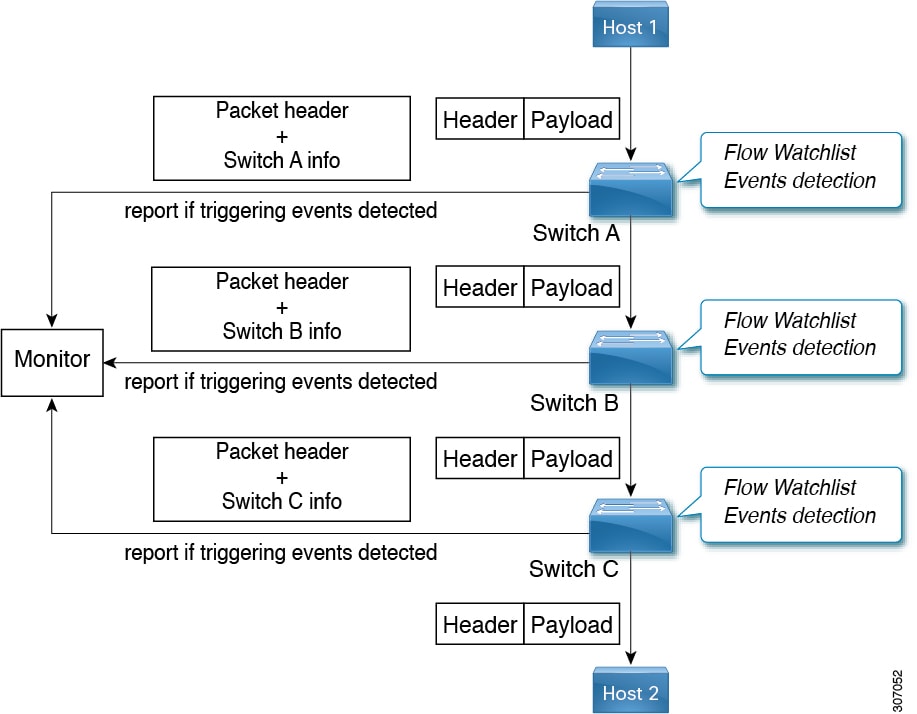
Local flow reports — Generated from flow events. Sent from the source or sink for host-to-host data flows matching the watchlist.
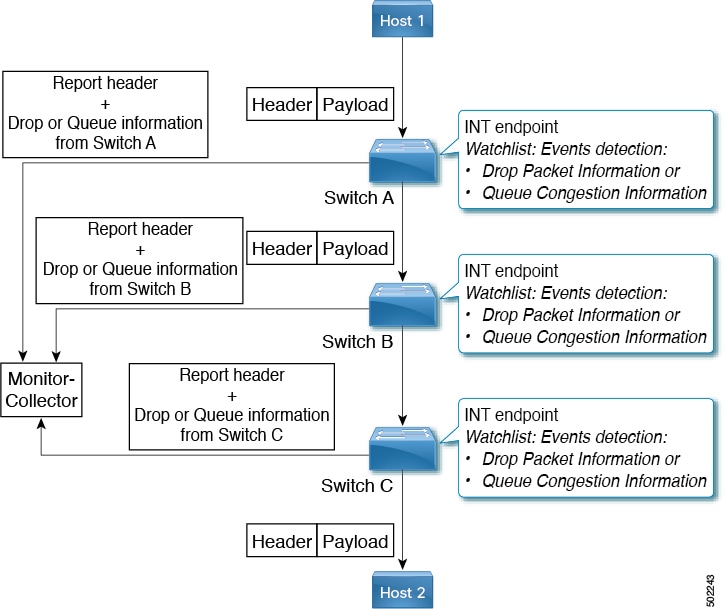
Drop reports — Generated from drop events.
Queue Congestion reports — Generated from queue-related events. Sent for packets exceeding the queue depth or latency.
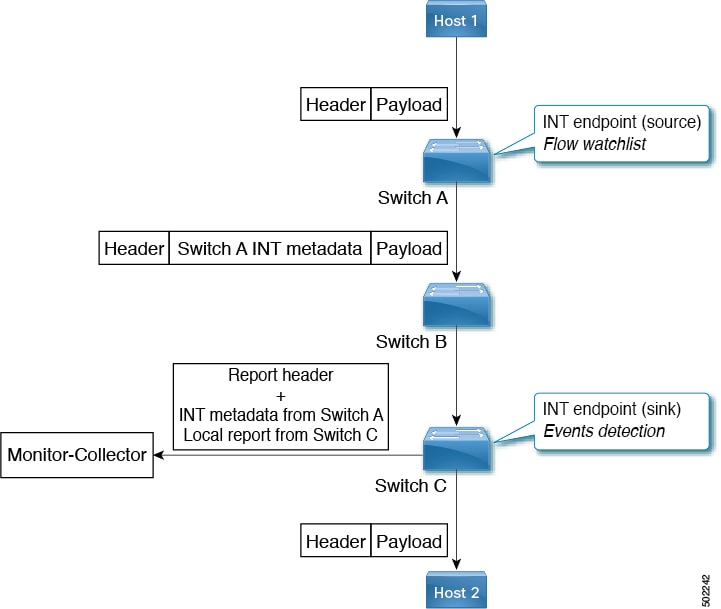
INT reports — Sent by the sink. When INT-encapsulated data packets are received on the sink fabric port, two reports are generated by the sink:
Local report for traffic arriving on a fabric port
INT report for data that is received from the source
Events
General | Flow Events | Drop Packet and Queue Congestion Events | Packet Postcards |
|---|---|---|---|
|
|
|
|
INT Collection Parameters
Ingress port identifier — The port on which the INT packet was received.
Ingress timestamp — The device local time when the INT packet was received on the ingress physical or logical port.
Egress port identifier — The port on which the INT packet was sent out.
Egress timestamp — The device local time when the physical or logical port processed the INT packet.
Queue occupancy — The build-up of traffic in the queue (in bytes, cells, or packets) that the INT packet observes in the device while being forwarded.
hardware-telemetry inband-telemetry
  inband-telemetry exporter e1
    destination 10.1.1.2
    transport udp 1000
  inband-telemetry record r1
    collect switch-id
    collect port-id
    collect queue-occupancy
    collect ingress-timestamp
    collect egress-timestamp
  inband-telemetry watchlist ip wl1
    20 permit ip 1.2.3.4/24 5.6.7.8/32
  inband-telemetry monitor m1
    record r1
    exporter e1
    watchlist wl1
  inband-telemetry queue-profile queue-profile-default
    depth 300
    latency 8192000
  inband-telemetry flow-profile
    dscp 1
    age 10
    latency quantization 28
inband-telemetry system monitor m1 |
inband-telemetry watchlist ip ...
inband-telemetry queue-profile queue-profile-default
inband-telemetry flow-profile