INT HW and SW
| Vendor | HW | SW on HW | SW | etc |
|---|---|---|---|---|
| Juniper | QFX5120 | Inband Flow Analyzer (IFA) 2.0 | ||
| Cisco | Cisco Nexus 3K, 9K | Streaming Telemetry license (N3K-STR1K9) | ||
| Intel (Barefoot) | Wedge32X | Deep Insight |
Juniper
- 마이크로 버스트
- End-to-End 패킷 전송 지연
- 노드의 패킷 지연
- 패킷이 지나가는 새로운 경로
Inband Network Telemetry (INT) is a vendor-neutral network monitoring framework that provides per-hop granular data in the forwarding (data) plane. INT allows you to observe changes in flow patterns caused by 1)microbursts, 2)packet transmission delay, 3)latency per node, and 4)new ports in flow paths.
Collection Params
- Residence time (latency)
- Per-hop latency
- Per-hop ingress port number
- Per-hop egress port number
- Received packet timestamp value
- Queue ID
- Congestion notification
- Egress port speed
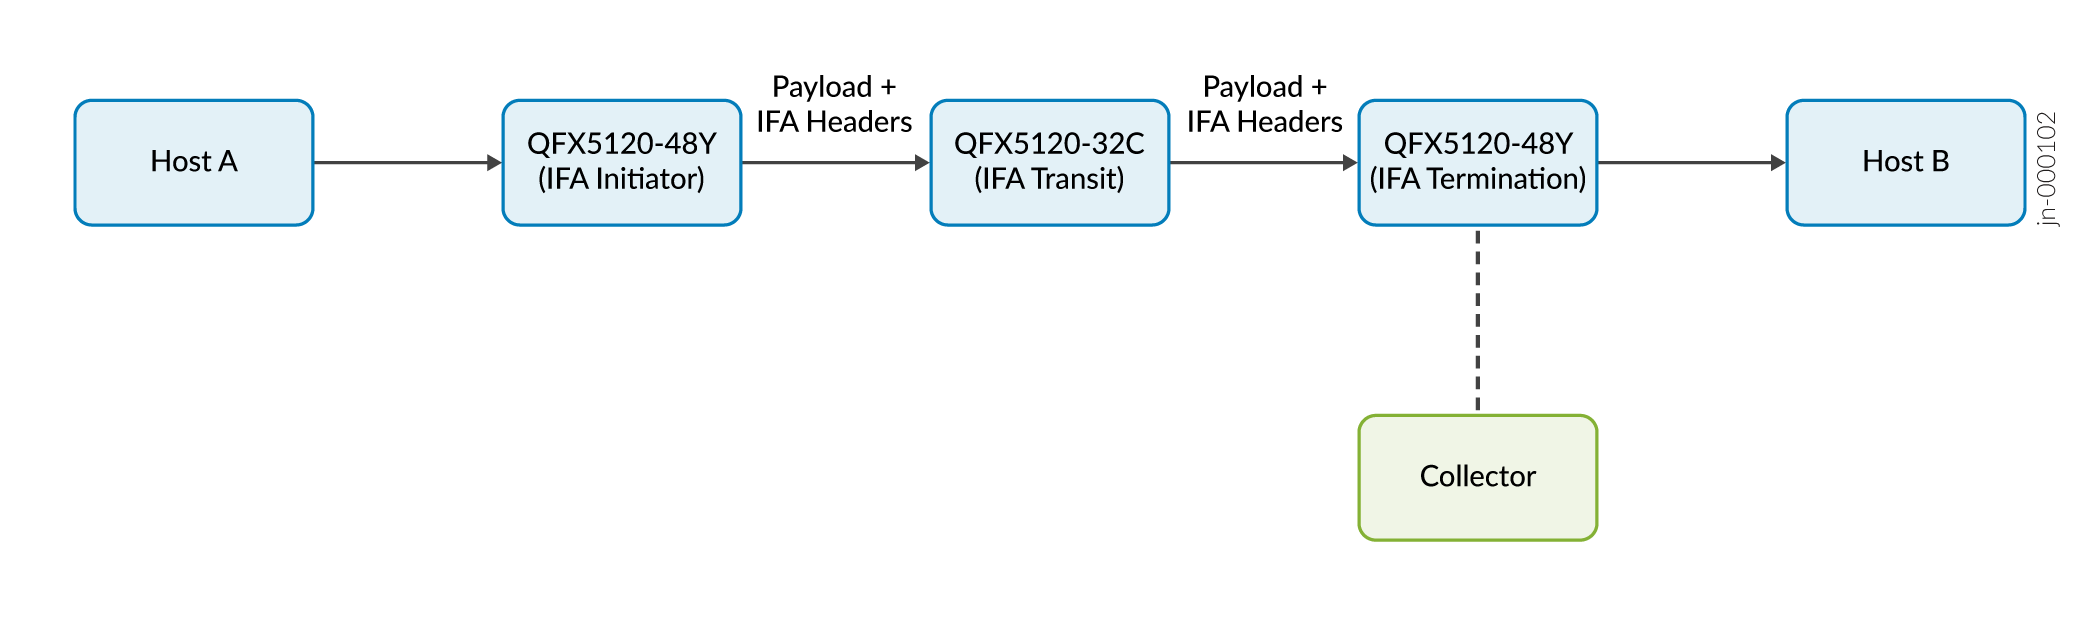
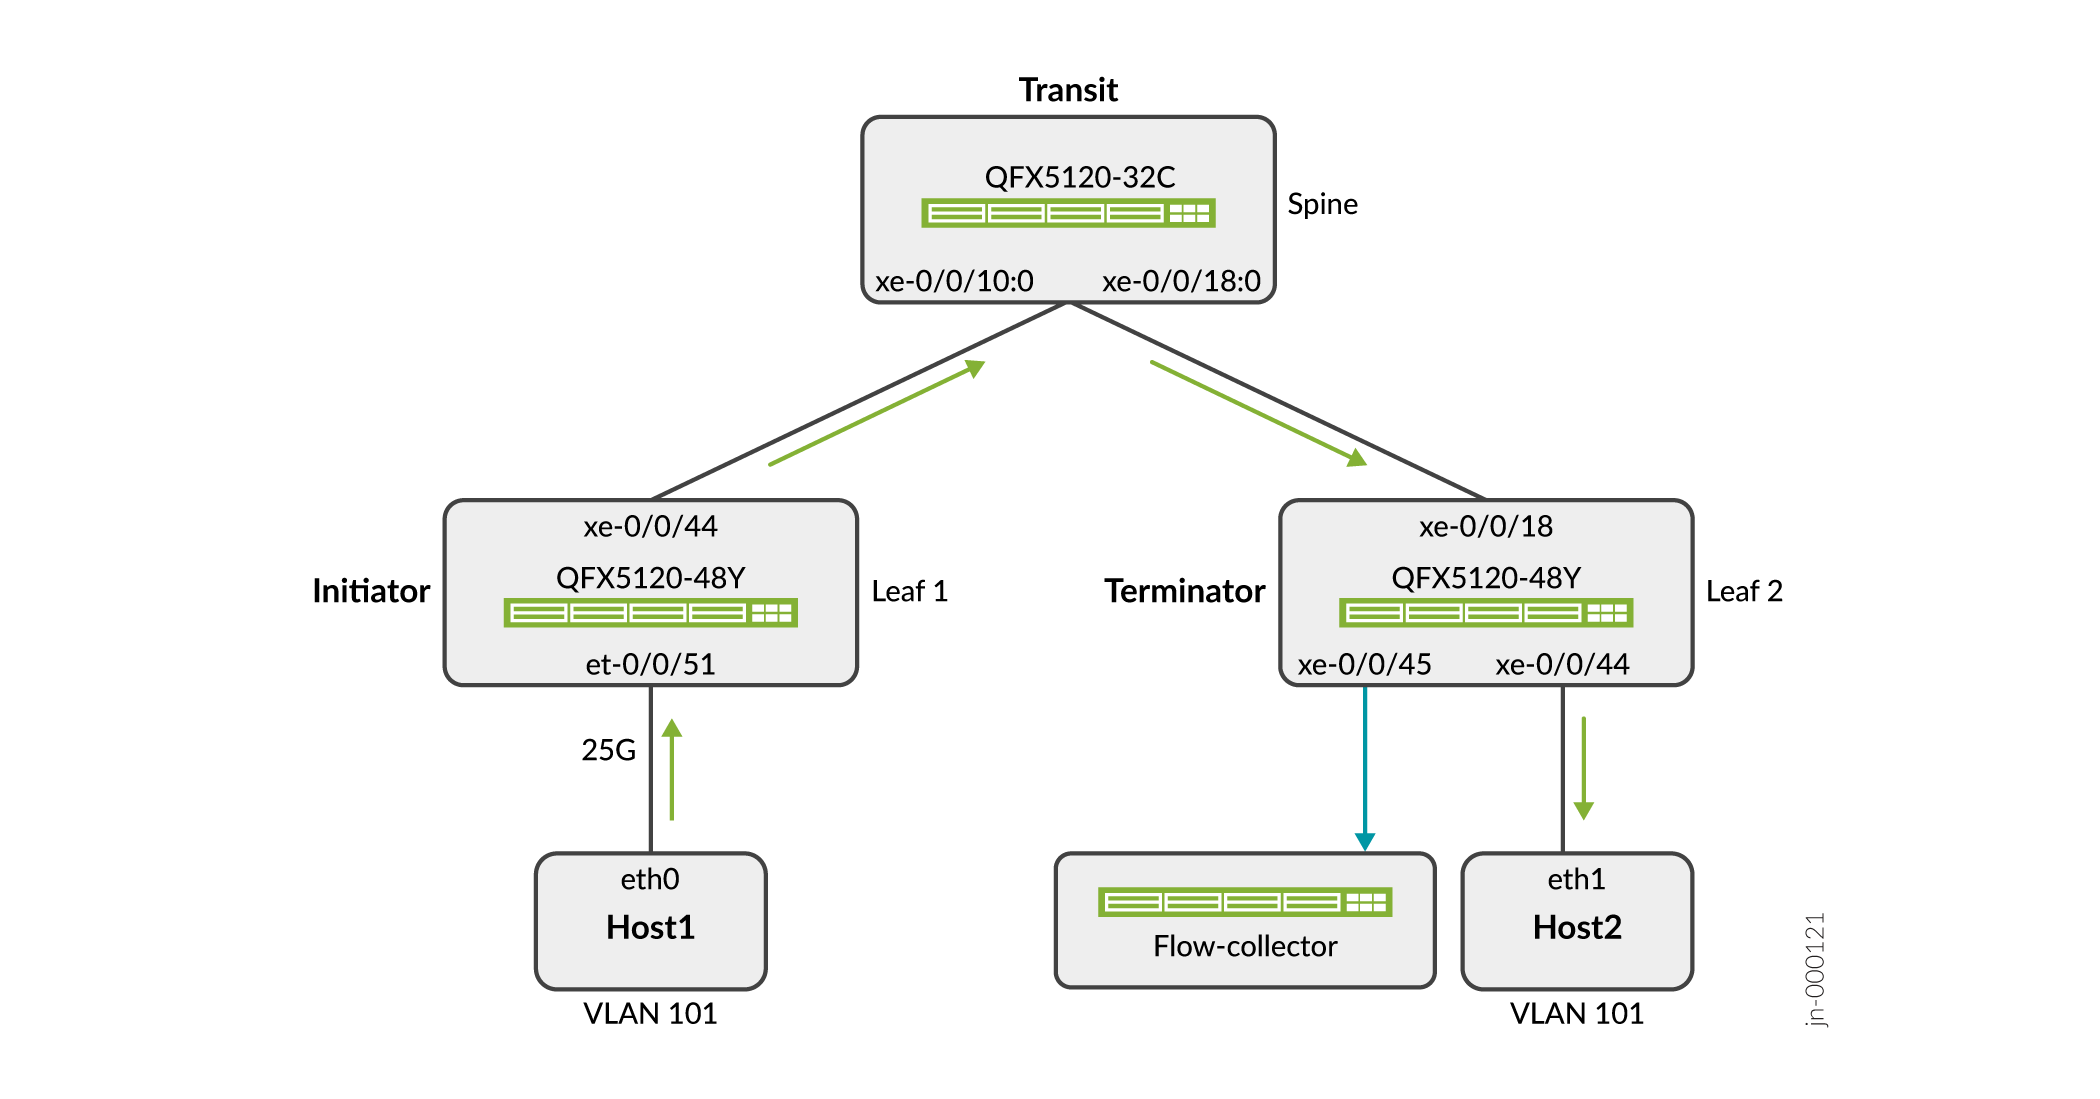
2022, Inband Flow Analyzer (IFA) 2.0 Probe for Real-Time Flow Monitoring > CLI Quick Configuration
https://www.juniper.net/documentation/us/en/software/junos/flow-monitoring/topics/topic-map/ifa2.0-probe-for-real-time-performance-monitoring.html#concept_rjb_tvr_hrb
- Config for IFA Initiator Node
- Config for IFA Transit Node
- Config for IFA Terminating Node
2022, Paragon Insights Data Ingest Guide > Understand Inband Flow Analyzer 2.0
https://www.juniper.net/documentation/en_US/healthbot/topics/concept/pi-inband-telemetry-overview.html
2022, Inband Flow Analyzer (IFA) 2.0 Probe for Real-Time Flow Monitoring
https://www.juniper.net/documentation/us/en/software/junos/flow-monitoring/topics/topic-map/ifa2.0-probe-for-real-time-performance-monitoring.html
Barefoot
- 패킷이 어느 경로를 지나왔나? - 트래픽이 하나의 경로로 전송될 땐 의미가 없을 듯...
- 패킷에 어느 룰이 적용되었는가?
- 패킷이 여러 큐를 지날 때, 각 큐에서 지체된 딜레이는 얼마인가?
- 어느 플로우와 큐를 쉐어하고 있나?


2018, OCPUS18 – InBand Network Telemetry - A Powerful Analytics Framework for Your Data Center
Speaker: Roberto Mari, Barefoot Networks
https://youtu.be/V7kheCbPh0g
2020, Barefoot Deep Insight Monitoring System Enabled by P4 DataPlane Telemetry
https://opennetworking.org/wp-content/uploads/2020/12/9_Daniel_Alvarez_DI.pdf
Cisco
Cisco Nexus 3000 Series NX-OS Programmability Guide, Release 9.3(x)
Cisco Nexus 9000 Series NX-OS Programmability Guide, Release 9.2(x)
- Model-Driven Programmability
- Model-Driven Telemetry
- Inband Network Telemetry
- hardware-telemetry inband-telemetry
- hardware-telemetry postcard-telemetry
2019, Explore MDT(Model-Driven Telemetry)
https://blogs.cisco.com/developer/model-driven-telemetry-sandbox
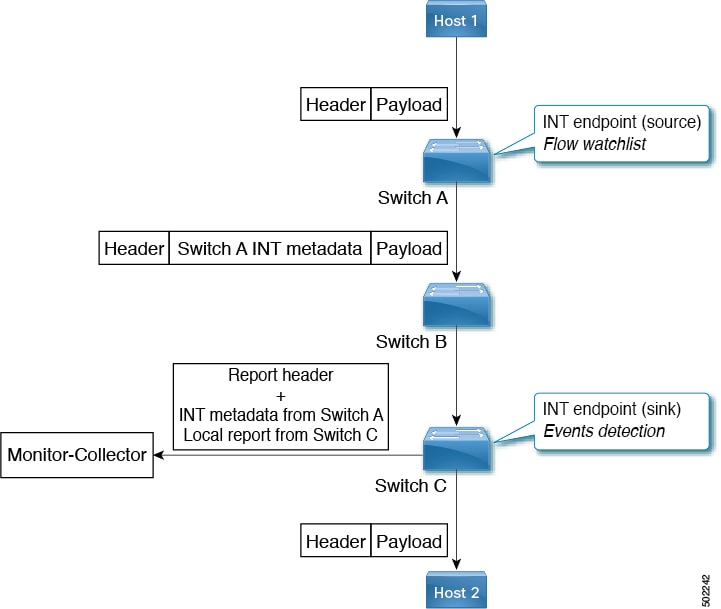
Report Types
Following are the different types of reports used by INT:
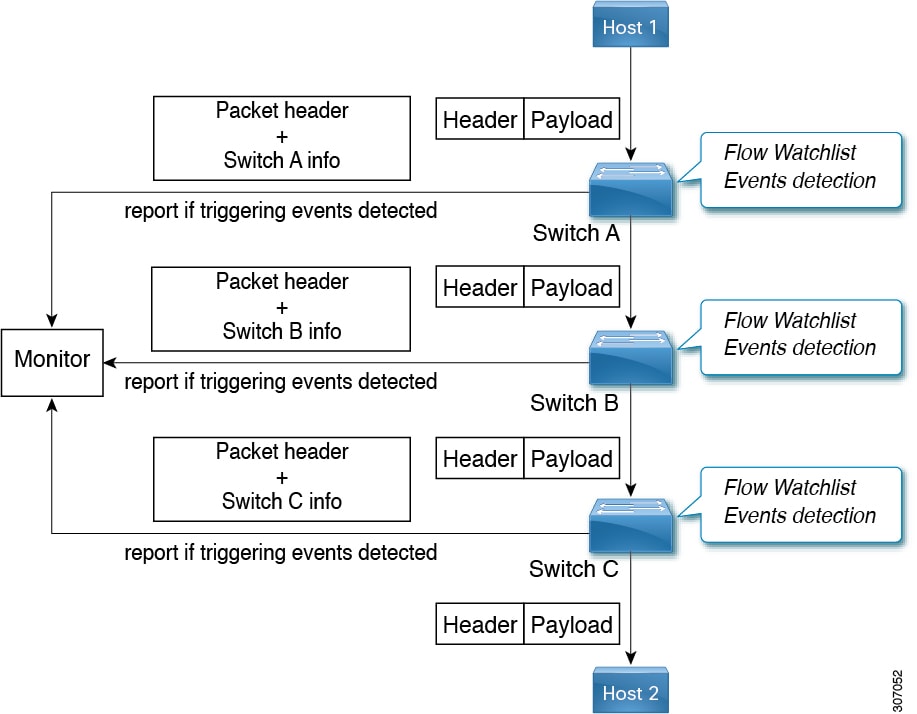
Local flow reports — Generated from flow events. Sent from the source or sink for host-to-host data flows matching the watchlist.
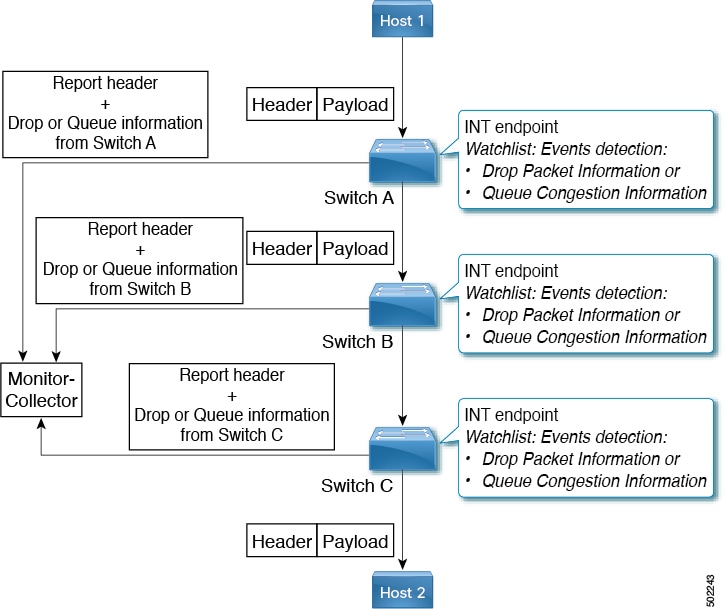
Drop reports — Generated from drop events.
Queue Congestion reports — Generated from queue-related events. Sent for packets exceeding the queue depth or latency.
INT reports — Sent by the sink. When INT-encapsulated data packets are received on the sink fabric port, two reports are generated by the sink:
Local report for traffic arriving on a fabric port
INT report for data that is received from the source
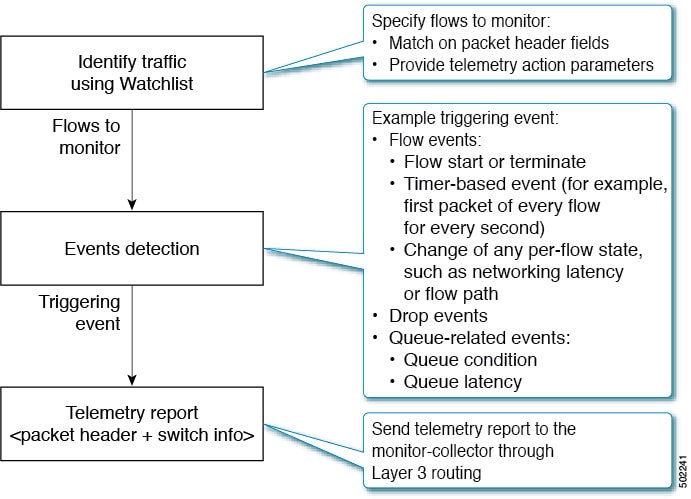
Events
General | Flow Events | Drop Packet and Queue Congestion Events | Packet Postcards |
|---|---|---|---|
|
|
|
|
INT Collection Parameters
- Switch ID — The unique ID of a switch
Ingress port identifier — The port on which the INT packet was received.
Ingress timestamp — The device local time when the INT packet was received on the ingress physical or logical port.
Egress port identifier — The port on which the INT packet was sent out.
Egress timestamp — The device local time when the physical or logical port processed the INT packet.
Queue occupancy — The build-up of traffic in the queue (in bytes, cells, or packets) that the INT packet observes in the device while being forwarded.
hardware-telemetry inband-telemetry
  inband-telemetry exporter e1
    destination 10.1.1.2
    transport udp 1000
  inband-telemetry record r1
    collect switch-id
    collect port-id
    collect queue-occupancy
    collect ingress-timestamp
    collect egress-timestamp
  inband-telemetry watchlist ip wl1
    20 permit ip 1.2.3.4/24 5.6.7.8/32
  inband-telemetry monitor m1
    record r1
    exporter e1
    watchlist wl1
  inband-telemetry queue-profile queue-profile-default
    depth 300
    latency 8192000
  inband-telemetry flow-profile
    dscp 1
    age 10
    latency quantization 28
  inband-telemetry system monitor m1
inband-telemetry watchlist ip ...
- Source IP Subnet
inband-telemetry queue-profile queue-profile-default
- depth-value is the queue-profile depth value, in number of cells. Congestion queue reports are generated for flows exceeding the configured queue depth. Allowed values: 1 to 204800. Default is 300.
- latency-value is the queue-profile latency, in nanoseconds. The latency value is the time from when the packet is put into the queue to the time when it is dequeued from the queue. Allowed values: 30 to 8192000. Default is 2048. If a violation happens, a queue congestion report is generated from the local switch when the congestion occurs. If needed, adjust the latency value to increase or decrease the number of reports you want in your deployment.
inband-telemetry flow-profile
- age-value is the flow-profile age, in seconds, when the exports are sent out. Used to determine the frequency at which a given flow is reported. Allowed values: 0 to 7200. Default is 30.
- latency-quant-value is the flow-profile latency quantization value. Flow reports are generated when the flow is exceeding the configured latency value. Only flows that match the watchlist are generated. This value is converted to a power of 2, in nanoseconds. For example, a value of 11 is converted to 2 power 11, or 2048. This calculation means that if the difference between the ingress timestamp and the egress timestamp is more than 2048 nanoseconds at any point in the path, one upstream or local report is generated per flow. Allowed values are 0 to 28. Default is 11.